Trend And Momentum
Apply supported moving averages, oscillators, and related technical studies to describe direction, strength, and changing market conditions.
Evidence-Based Chart Research
Study trend, momentum, volatility, patterns, support, resistance, and price-time relationships with configurable charts, indicators, drawings, screeners, and replay tools.
Technical Workflow
TimeMatrix technical analysis software is designed for repeatable chart research. Define the symbol and interval, apply only the tools relevant to the hypothesis, record the settings, and compare the result with broader market and historical context.
Platform Capabilities
Apply supported moving averages, oscillators, and related technical studies to describe direction, strength, and changing market conditions.
Examine supported volatility, range, and volume-derived evidence beside price action rather than interpreting a signal in isolation.
Use pattern studies, support and resistance, pivots, measurements, and annotations to make the reasoning visible on the chart.
Compare short- and long-horizon evidence with multiple chart windows and configurable intervals.
Use Bar Replay and saved chart context to review historical decisions and refine a repeatable process.
Extend conventional technical analysis with Gann geometry, number matrices, cycles, and astronomical timing when those methods are part of the research plan.
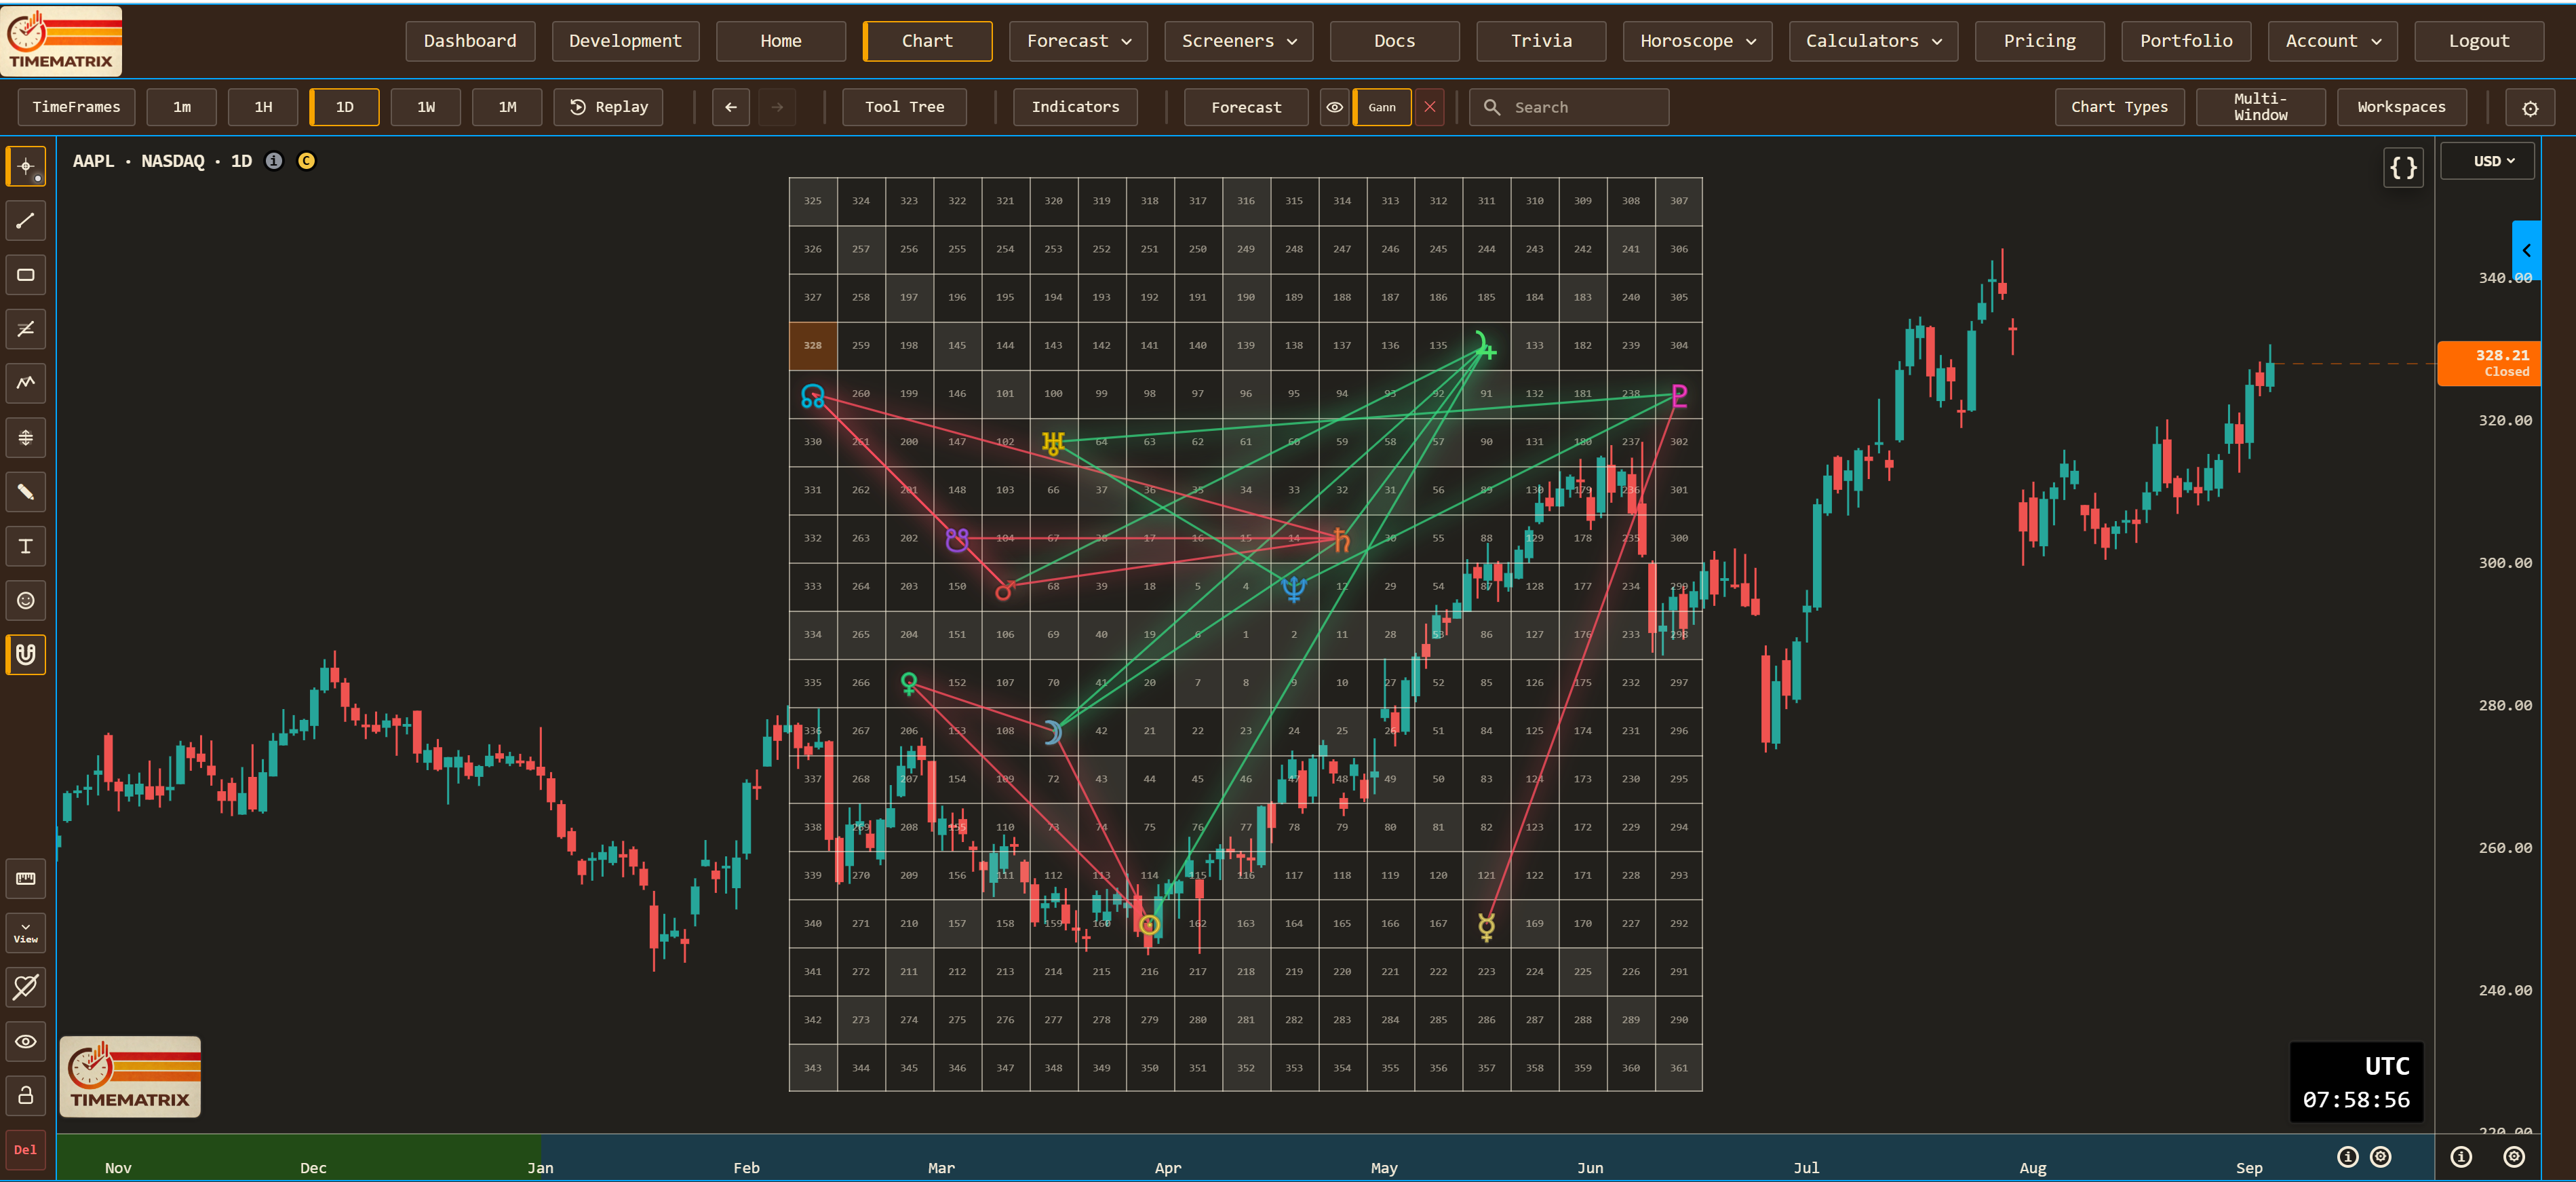
Explore Apple (AAPL) end-of-day charts, indicators, drawing tools, and native Square of 9 and Gann Hexagon overlays in your browser. The free demo needs no signup or credit card and has no timed trial. Demo work is not saved; other symbols and saving require membership.
Common Questions
Technical analysis software helps researchers examine price, trend, momentum, volatility, volume, patterns, and support or resistance using charts, indicators, and drawing tools.
TimeMatrix combines configurable chart types, indicators, drawing tools, pattern studies, multi-timeframe layouts, measurements, Bar Replay, watchlists, screeners, and saved research workspaces.
Yes. A technical observation can be evaluated beside fundamentals, screeners, heatmaps, seasonality, historical cycles, Gann geometry, and astronomical timing without treating any one method as decisive.
No. Indicators describe selected market data and settings. They do not guarantee an outcome and should be interpreted with independent research and risk controls.