Multiple Chart Types
Switch among supported candle, bar, line, area, column, and hollow-candle presentations while preserving the underlying research context.
Browser-Based Financial Charts
Build technical studies with interactive charts, multi-window layouts, indicators, drawing tools, Bar Replay, watchlists, saved charts, and configurable workspaces.
Charting Workspace
TimeMatrix professional charting software keeps symbol discovery, chart construction, research tools, and saved context connected. Start with conventional price analysis, then add specialized evidence only when it serves the question being tested.
Platform Capabilities
Switch among supported candle, bar, line, area, column, and hollow-candle presentations while preserving the underlying research context.
Use synchronized layouts with up to six chart windows to compare intervals, instruments, and analytical perspectives.
Apply technical studies, patterns, measurements, annotations, and drawing tools from the chart interface.
Move through historical price action sequentially to review decisions without exposing every later bar at once.
Organize symbols and retain chart configurations so recurring research can resume without rebuilding the workspace.
Place Square of 9, Hexagon, zodiac, and astronomical research directly beside ordinary market structure.
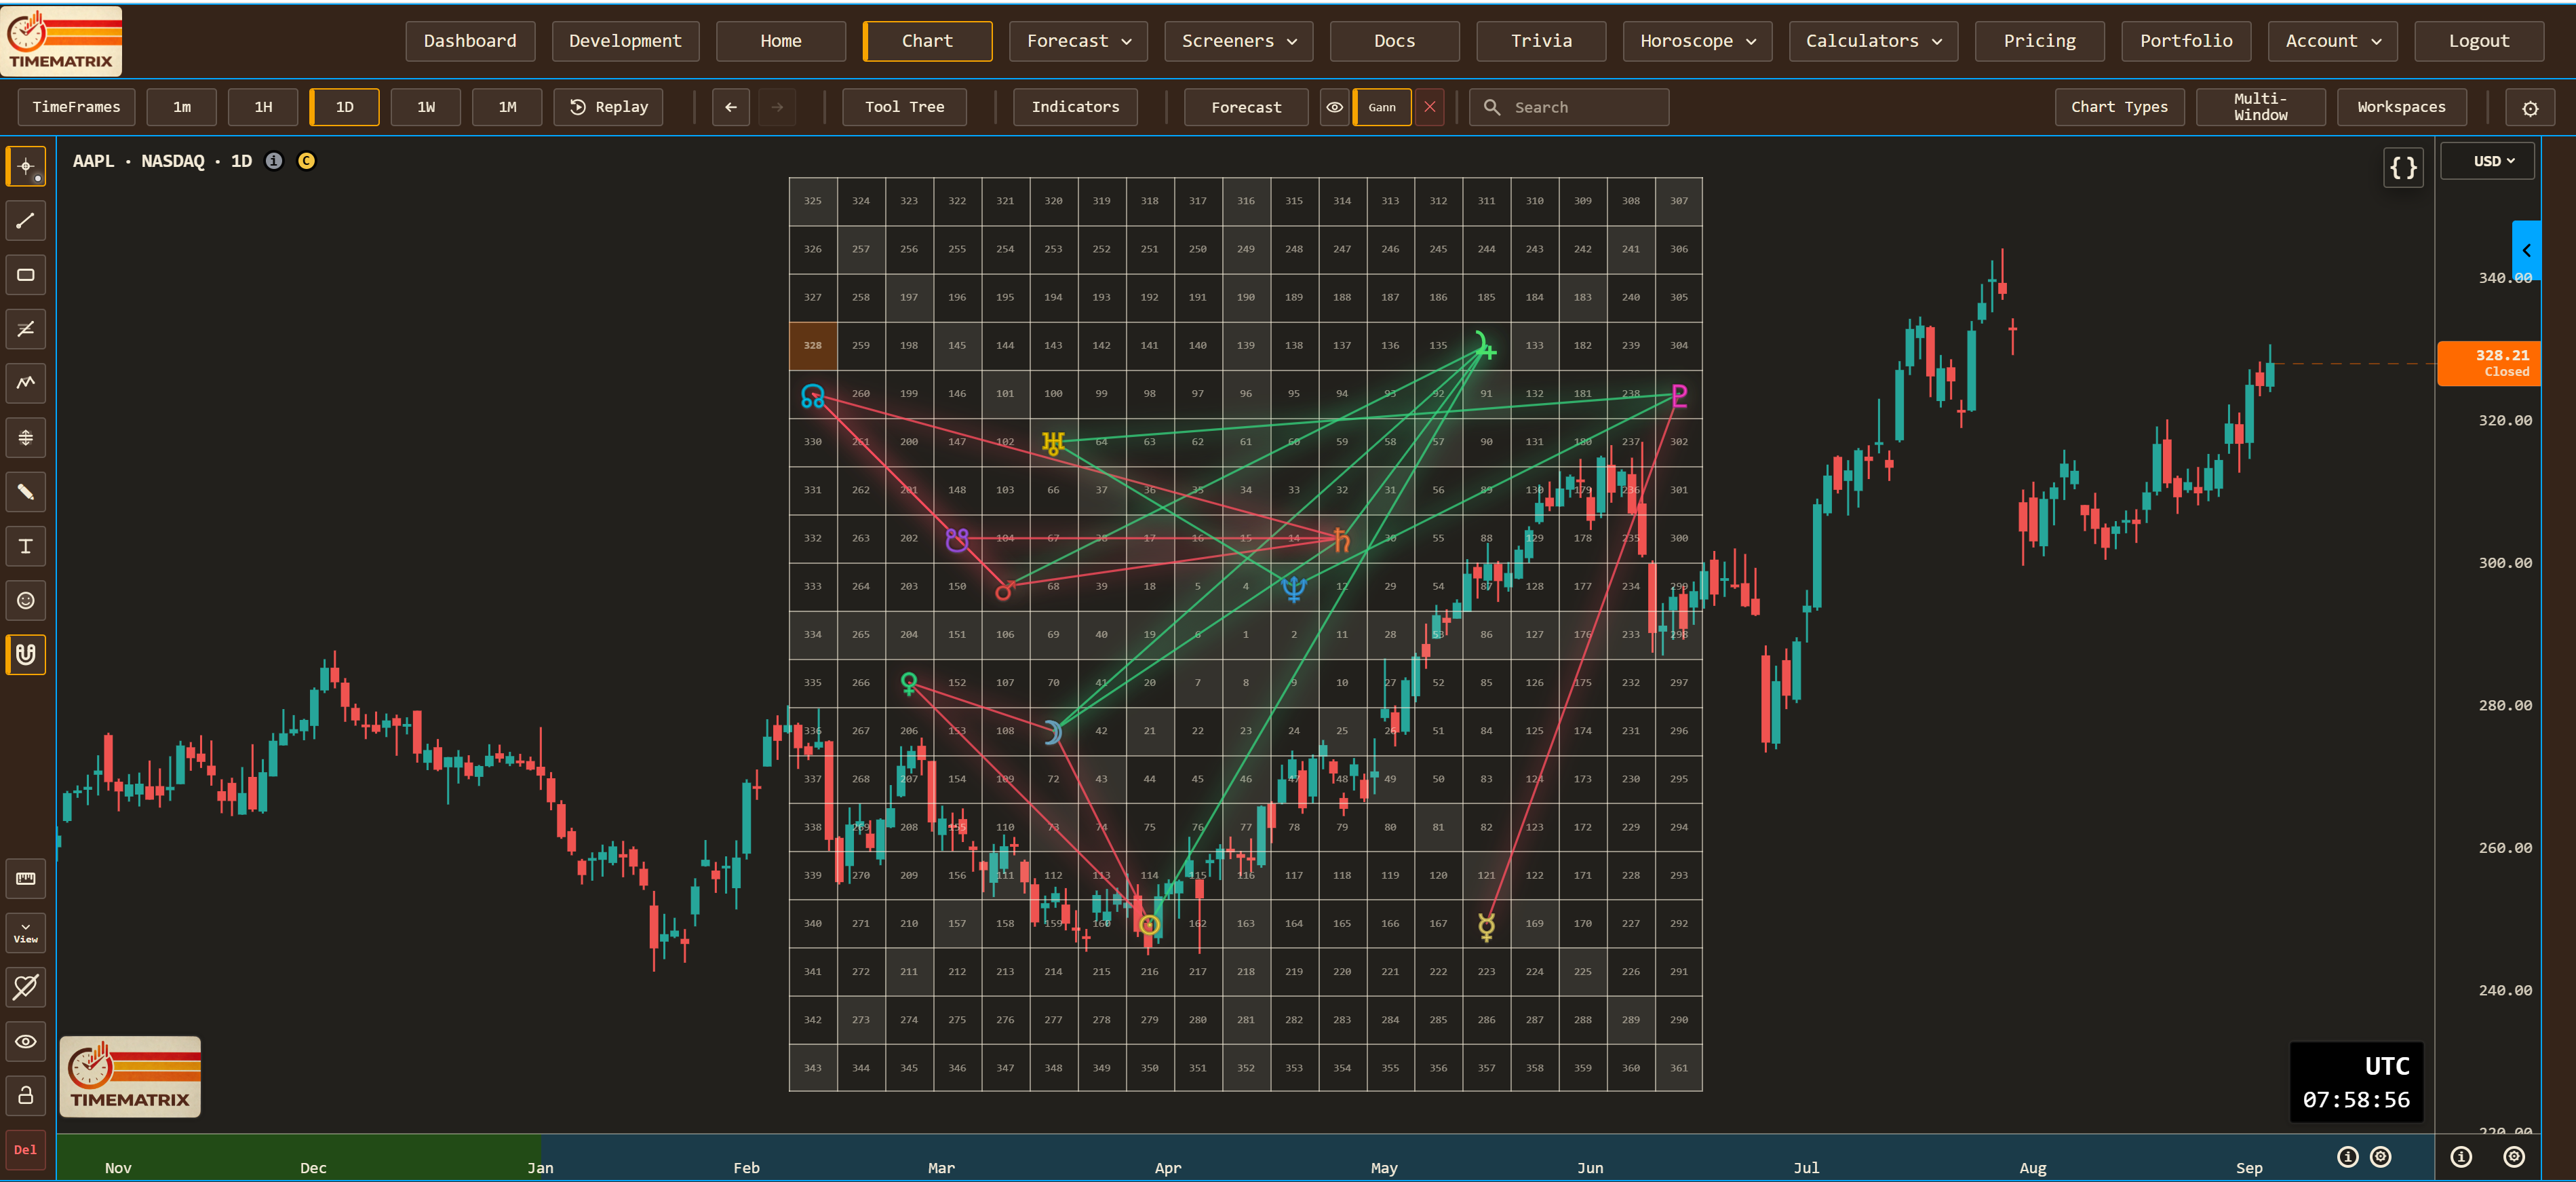
Explore Apple (AAPL) end-of-day charts, indicators, drawing tools, and native Square of 9 and Gann Hexagon overlays in your browser. The free demo needs no signup or credit card and has no timed trial. Demo work is not saved; other symbols and saving require membership.
Common Questions
TimeMatrix provides interactive financial charts, multiple chart types, technical indicators, drawing tools, Bar Replay, synchronized multi-window layouts, watchlists, saved charts, and configurable workspaces.
Yes. Multi-window layouts can display up to six chart windows for comparing symbols, intervals, indicators, and research perspectives in one workspace.
Members can save chart and workspace state so configured layouts, tools, and research context can be restored later.
Yes. Alongside conventional studies and drawings, TimeMatrix includes native Square of 9 and Hexagon overlays, zodiac and astronomical context, and price-time research tools.