Ranked Historical Matches
Compare a selected market window with previous years and review ranked likeness scores with compact path previews.
Scenario-Based Market Research
Compare historical paths, rank cycle similarities, inspect seasonality, and place selected scenarios on the active chart while keeping uncertainty visible.
Forecast Workspace
TimeMatrix market forecasting software is built for scenario analysis rather than certainty. Researchers can define a comparison window, inspect ranked historical matches, and monitor where an extended path continues to fit or begins to fail.
Platform Capabilities
Compare a selected market window with previous years and review ranked likeness scores with compact path previews.
Normalize and extend a selected match on the active chart so its assumptions and divergences remain visible.
Examine recurring calendar behavior and historical percentage returns across supported research surfaces.
Review confirmed historical pivots and percentage changes without presenting them as future turning-point probabilities.
Evaluate a scenario beside technical structure, Gann geometry, astronomical timing, and ordinary risk considerations.
Keep the instrument, starting point, window, match count, transformation, and visual settings explicit so the comparison can be repeated.
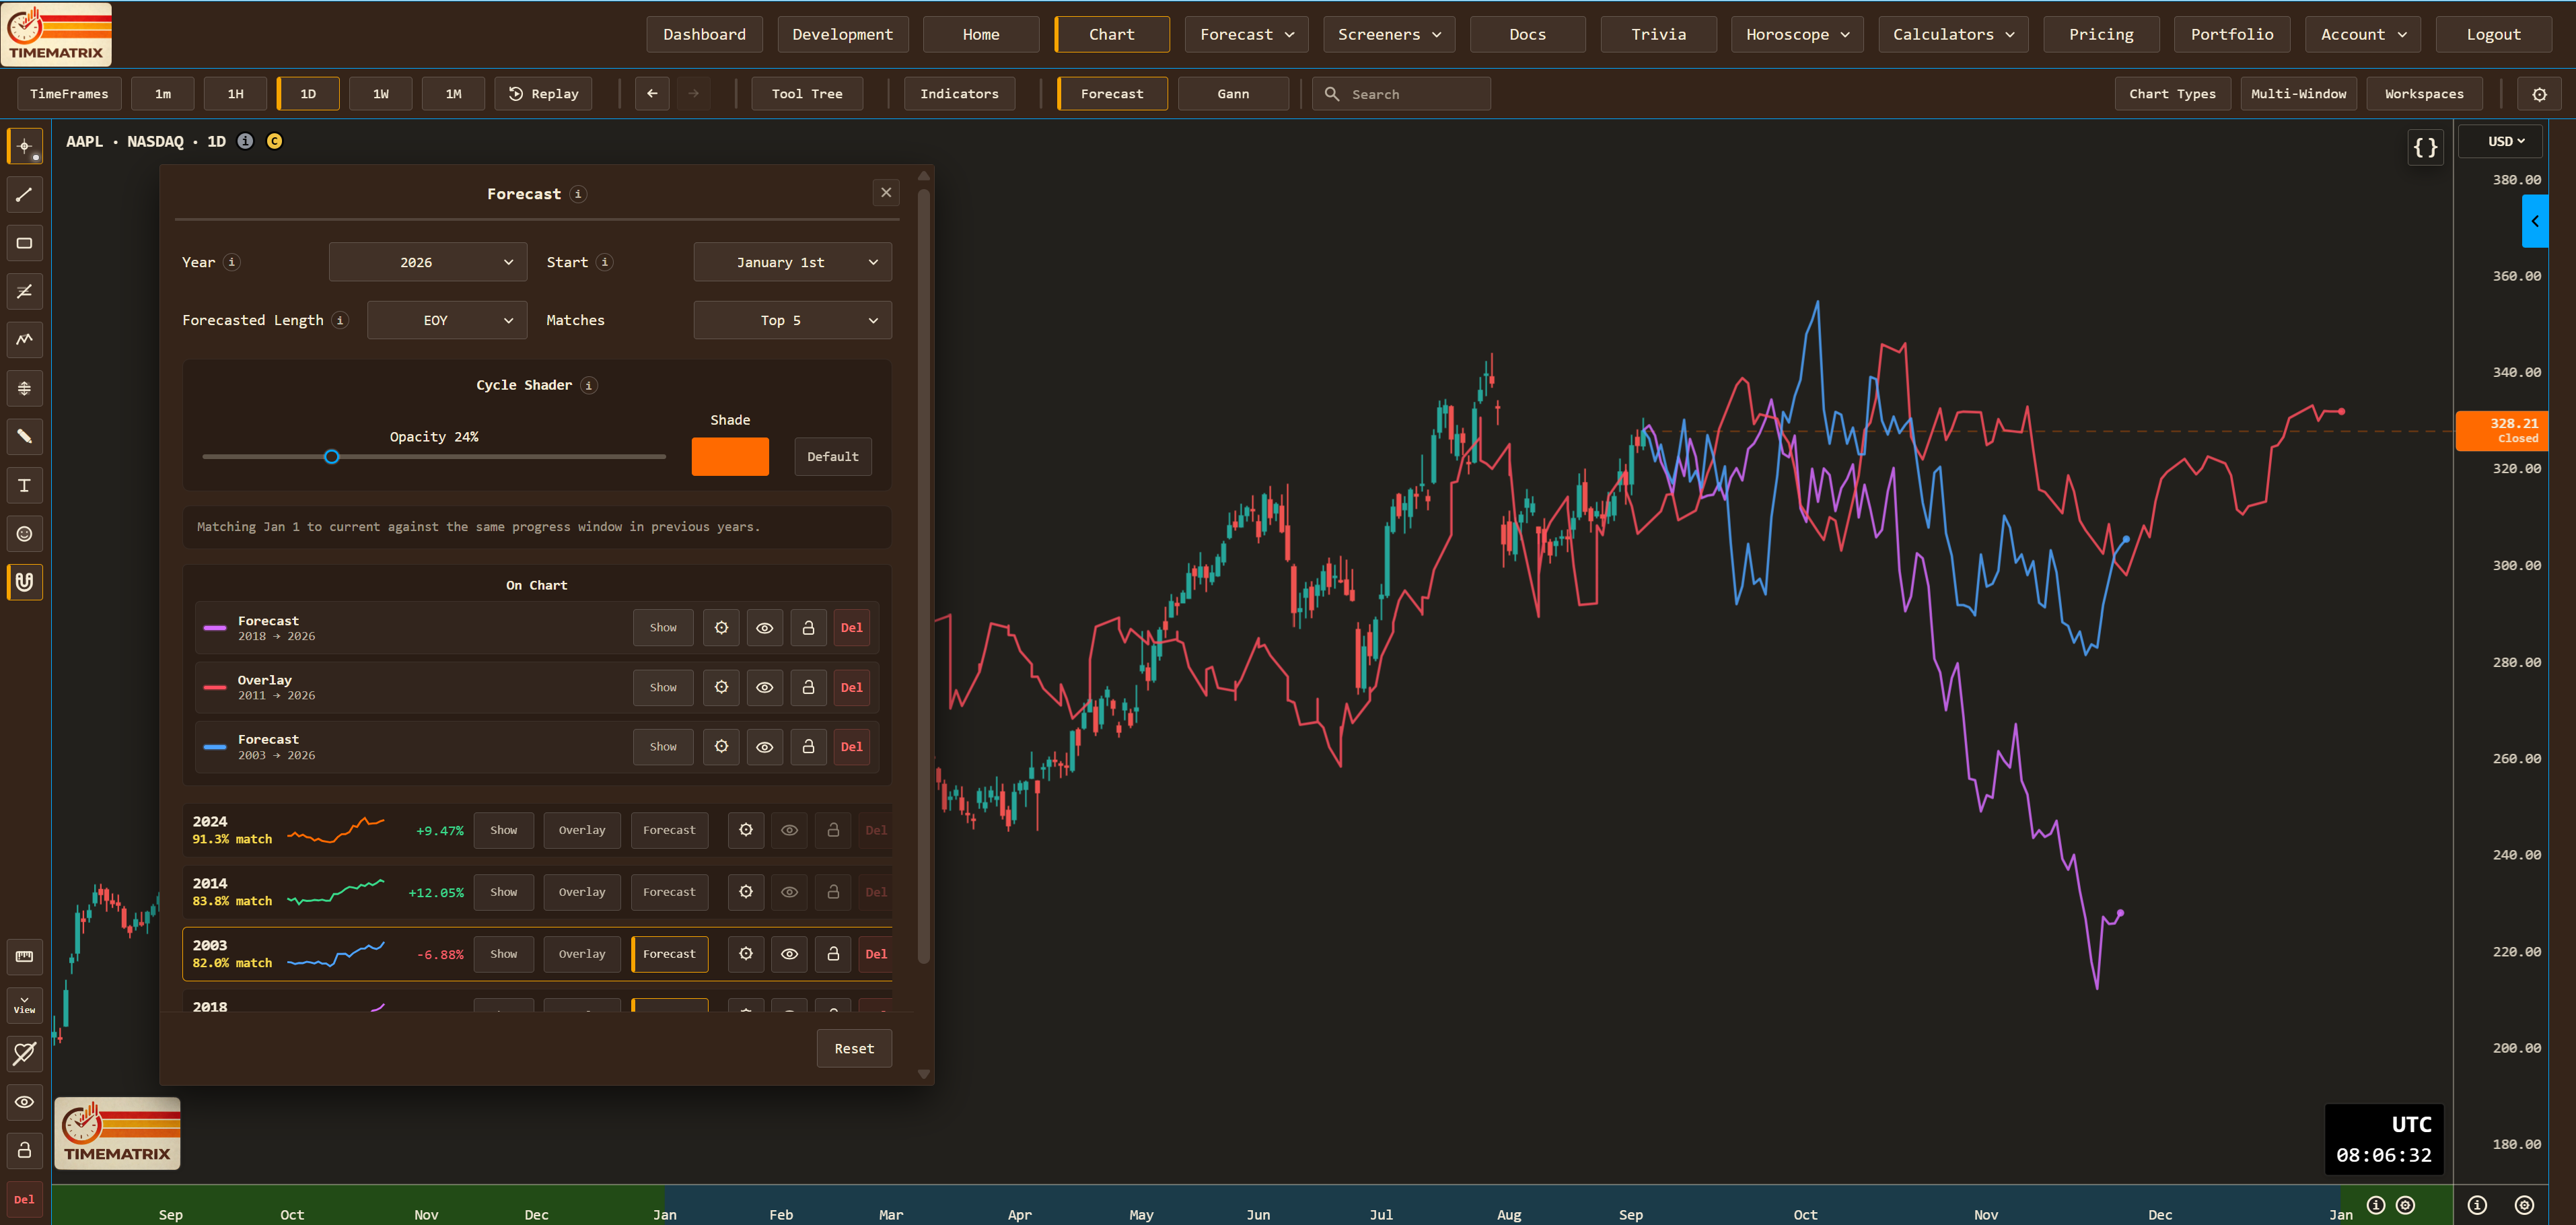
Explore Apple (AAPL) end-of-day charts, indicators, drawing tools, and native Square of 9 and Gann Hexagon overlays in your browser. The free demo needs no signup or credit card and has no timed trial. Demo work is not saved; other symbols and saving require membership.
Common Questions
TimeMatrix provides scenario-building tools based on ranked historical similarities, seasonality, recurring cycles, technical evidence, price-time geometry, and configurable research overlays.
A scenario shows one possible path under stated assumptions. It is designed to be monitored and challenged as new information appears rather than presented as a guaranteed prediction.
A selected historical match can be inspected, normalized, overlaid, or extended on the active chart as a visible research scenario.
No. A score only describes similarity within the selected data and window. Market structure, volatility, liquidity, regime changes, and parameter choices can alter what happens next.