Defined Comparison Windows
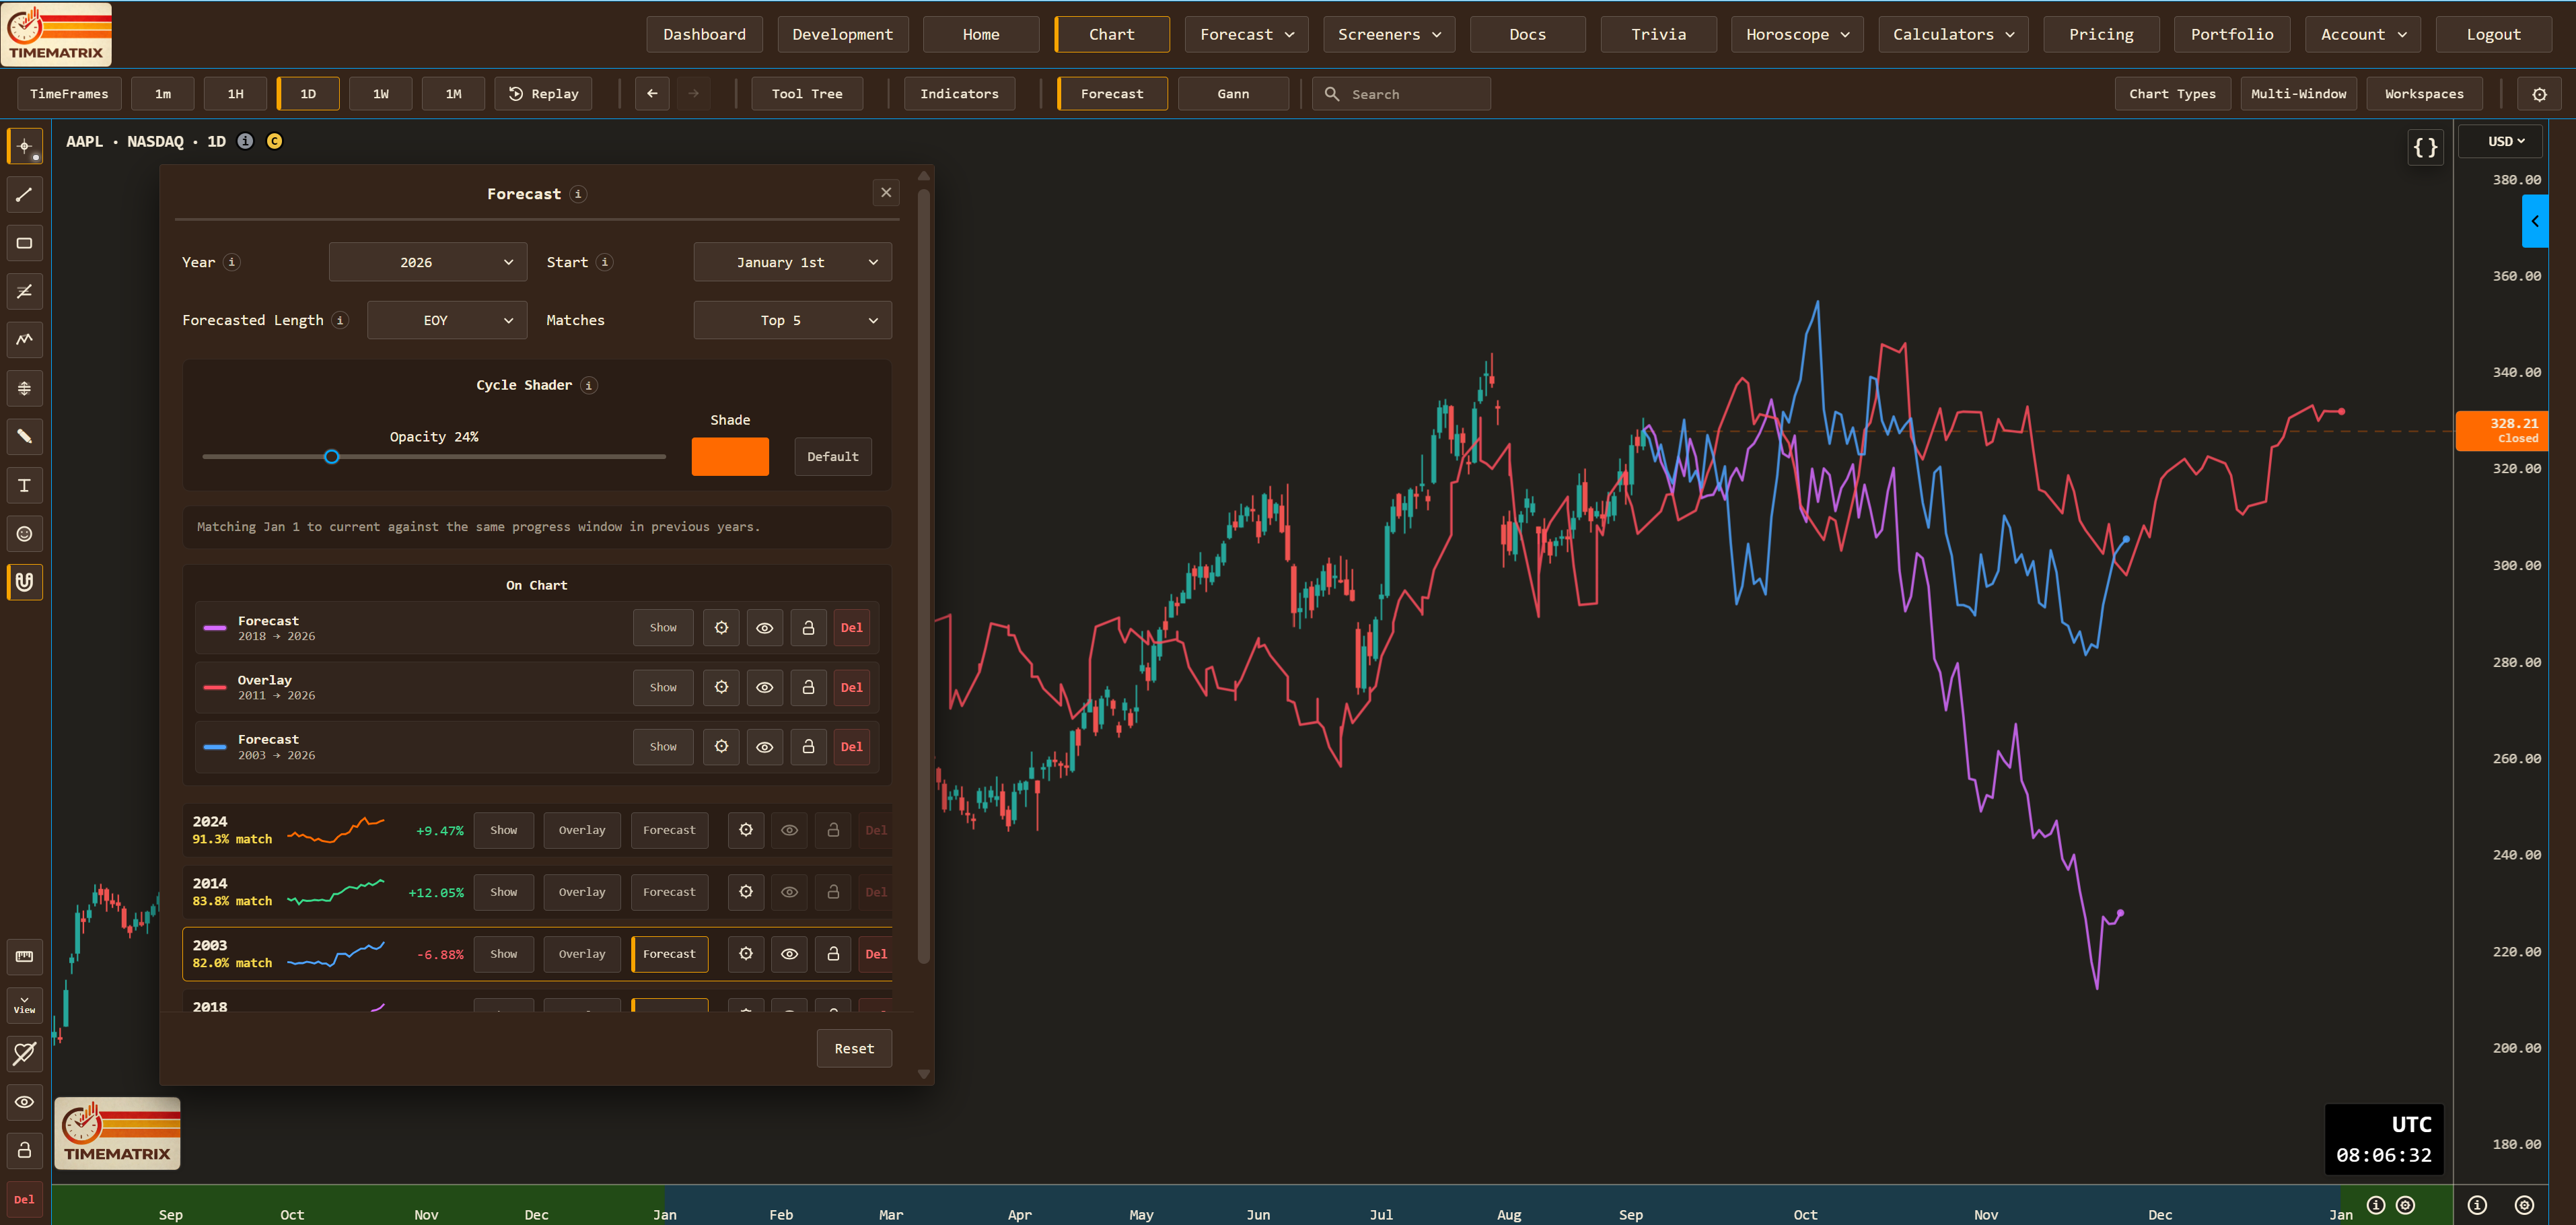
Choose the year, starting point, forecast length, and number of matches so the comparison question remains visible and repeatable.
Historical Comparison Tools
Compare a defined market interval with historical periods, inspect ranked similarities, and turn selected matches into visible chart scenarios—not promises that history must repeat.
Direct Answer
TimeMatrix market cycle software helps researchers compare price behavior across years and timing frameworks without detaching the result from the underlying chart. A selected historical match can be inspected, overlaid, or extended as a forecast scenario, then checked against current structure and other evidence.
Forecast Workspace
Choose the year, starting point, forecast length, and number of matches so the comparison question remains visible and repeatable.
Review similarity scores and compact path previews rather than selecting only a memorable year after seeing how it ends.
Open a historical match in context or overlay its normalized path on the active chart to inspect where the comparison fits and fails.
Extend a chosen match beyond the comparison window as a charted scenario that can be hidden, adjusted, or removed as the market produces new information.
Use consistent visual shading and supported starting anchors to make repeated comparisons easier to read across different windows.
Compare historical cycles with seasonality, technical indicators, Gann geometry, astronomical timing, and ordinary price structure without treating any single lens as decisive.
Interpretation
A high historical likeness score applies to a selected instrument, interval, transformation, and window. It does not prove a stable cause or require the next segment to follow the earlier path. Market structure, participants, volatility, liquidity, macro conditions, data revisions, and parameter choices can all alter the result. Treat an extension as a scenario to monitor, not an instruction to trade.
Common Questions
Market cycle analysis software helps compare a defined market window with historical periods, recurring calendar structures, and other timing models to study similarities and differences.
The Forecast workspace ranks historical matches for a selected interval and lets a researcher inspect, overlay, or extend a chosen match as a scenario on the chart.
No. Similarity describes the selected data and window; it does not establish that the future will repeat. Regime changes, sample choices, liquidity, and risk still matter.
Yes. TimeMatrix brings historical cycle comparisons, Gann price-time geometry, astronomical overlays, indicators, and drawing tools into the same research platform so each method can be evaluated in context.